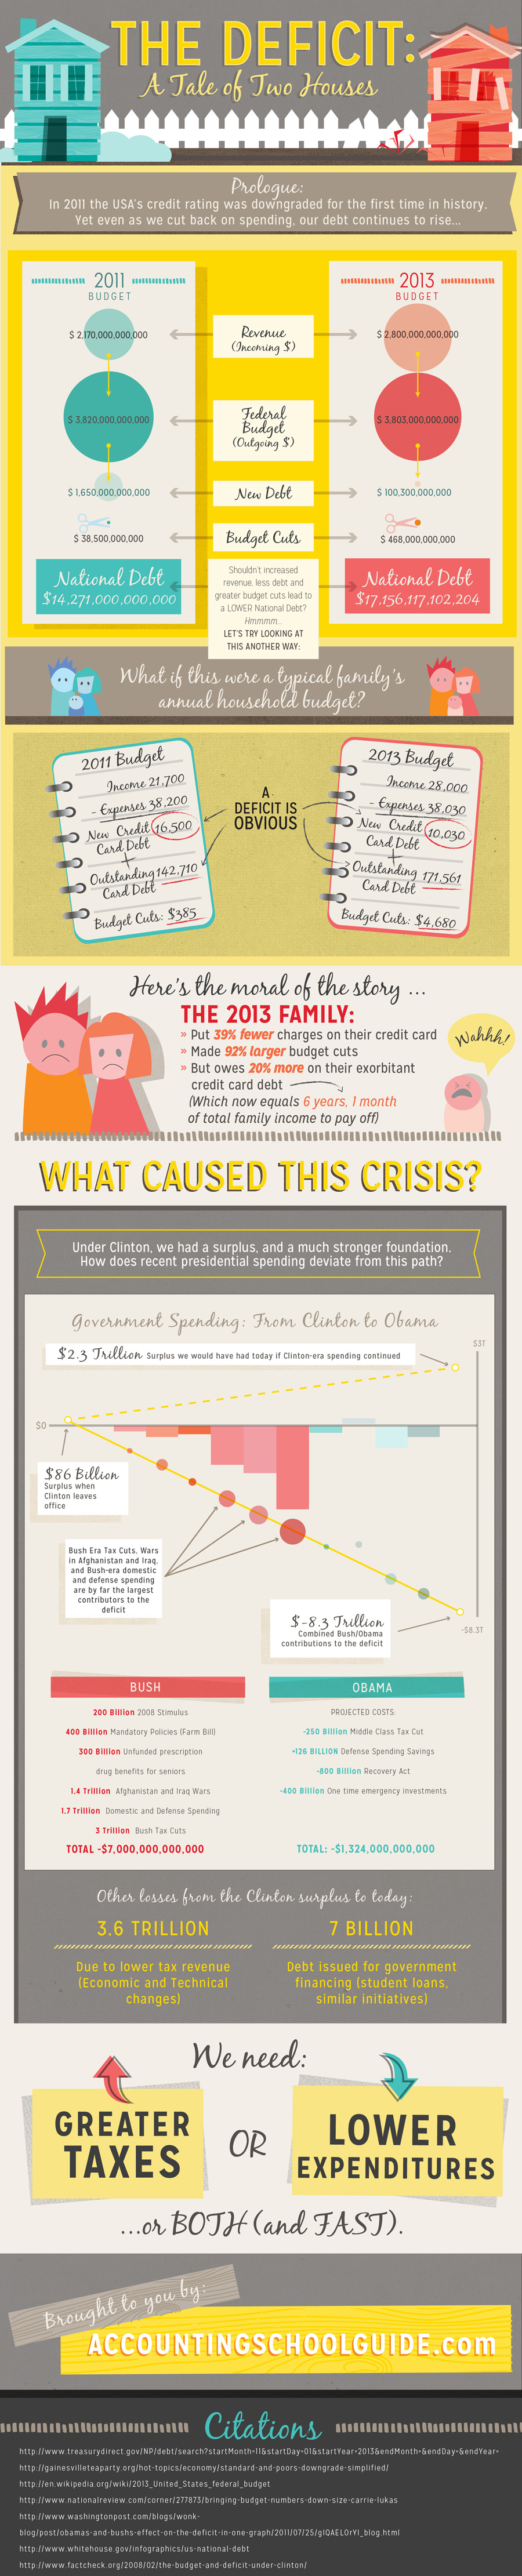
The Deficit: A Tale of Two Houses
In 2011, for the first time in history, our credit rating was downgraded
Our budget looked like this:[2]
2011: (When our credit rating was downgraded)
U.S. Tax revenue: $2,170,000,000,000
Federal budget: $3,820,000,000,000
New debt: $ 1,650,000,000,000
National debt: $14,271,000,000,000
Recent [April] budget cut: $ 38,500,000,000
Too many zeros?
What if this were a single family’s budget?
Subtract 8 zeroes:
Annual family income: $21,700
Money the family spent: $38,200
New debt on the credit card: $16,500
Outstanding balance on the credit card: $142,710
Budget cuts: $385
So…
The family spent 76% more than they had with a credit card
Bringing the credit card balance to 657% of family income
But the family did cut back spending by roughly 1%…
The first house fell, what about today’s?
2013:
Total Direct revenue: $2,800,000,000,000
Federal Budget: $3,803,000,000,000
New Debt: $100,300,000,000
National Debt:$17,156,117,102,204
Savings relative to last year: $468,000,000,000
Too many zeros?
What if this were a single family’s budget?
Subtract 8 zeroes…
Annual Family Income: $28,000
Money the Family Spent: $38,030
New Debt on Credit Card: $10,030
Outstanding Credit Card Debt: $171,561
Budget Cuts:$4,680
The 2013 family makes 29% more than the 2011 family
Put 39% less new charges on their credit card
Made 92% larger budget cuts
But owes 20% more on their exorbitant credit card debt.
Which now equals 6 years, 1 month of total family income to pay off.
A deficit is obvious.
Our debt has increased in tandem with our debt cutting.
What caused this crisis?
From Clinton’s surplus to today:
-$3,600,000,000,000 Economic and Technical Changes (lower tax revenue)
-$700,000,000,000 Debt issued for government financing (student loans, similar initiatives)
(2001-2008) Bush Era Components[5][6]
-$400,000,000,000 Mandatory Policies (Farm Bill)
-$1,400,000,000,000 Afghanistan and Iraq Wars
-$1,700,000,000,000 Domestic and Defense Spending
-$200,000,000,000 2008 Stimulus
-$300,000,000,000 Unfunded prescription drug benefits for seniors
-$3,000,000,000,000 Bush Tax Cuts
Total -$7,000,000,000,000
(2009-2017) (Projected costs)Obama Era Components
-$400,000,000,000 One time emergency investments
-$250,000,000,000 Middle Class Tax Cut
-$800,000,000,000 Recovery Act
+$126,000,000,000 Defense Spending Savings
Total: $1,324,000,000,000
Bush Era Tax Cuts, Wars in Afghanistan and Iraq, and Bush-era domestic and defense spending are by far the largest contributors to the deficit.
If Clinton’s policies had continued
2011: +$2,300,000,000,000 Surplus
We need greater taxes, or lower expenditures, or both. And Fast.
Citations:
- http://en.wikipedia.org/wiki/2013_United_States_federal_budget
- http://www.nationalreview.com/corner/277873/bringing-budget-numbers-down-size-carrie-lukas
- http://www.washingtonpost.com/blogs/wonkblog/post/obamas-and-bushs-effect-on-the-deficit-in-one-graph/2011/07/25/gIQAELOrYI_blog.html
- http://www.whitehouse.gov/infographics/us-national-debt